Dashboard Overview: Your FeedbackRobot Home Base
When you first navigate to your FeedbackRobot dashboard, you’re greeted by a command center that combines onboarding guidance, high-level metrics, and live feedback streams. Below is a breakdown of each section, complete with where to drop your screenshot and the exact alt text to use.
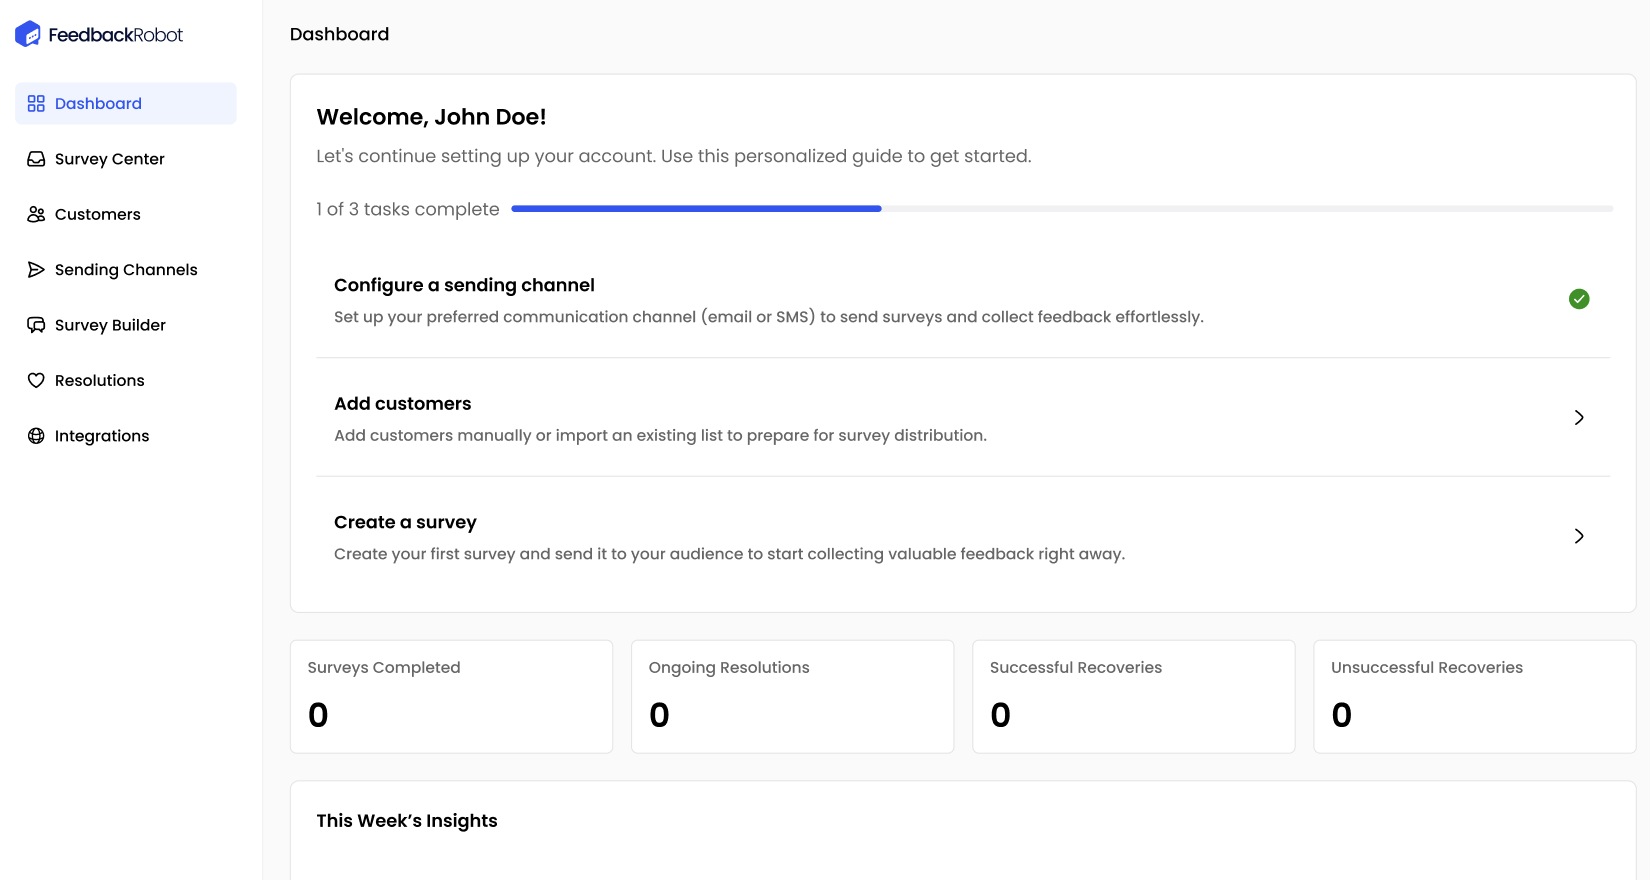
1. Personalized Onboarding Progress
What it shows
-
A warm greeting (“Welcome, John Doe!”)
A Step 1–3 progress bar tracking your completion of
- Configure a sending channel
- Add customers
- Create a survey
This banner guides new users through setup, ensuring you never miss a critical step. As you check off each task, the bar fills until you’re fully onboarded.
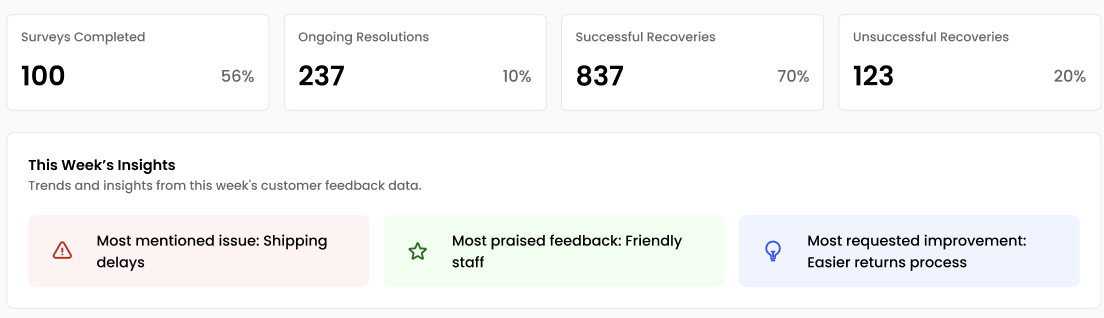
2. Key Metric Cards
What it shows
Immediately below onboarding, four metric cards present your core stats:
- Surveys Completed - total feedback forms sent
- Ongoing Resolutions - issues currently being handled
- Successful Recoveries - customers happily won back
- Unsuccessful Recoveries - recovery attempts that fell short
These cards update live, giving you at-a-glance insight into volume and performance without digging into reports.
3. This Week’s Insights
What it shows
A highlight panel surfaces your top feedback takeaways for the week
- Most mentioned issue (e.g., “Shipping delays”)
- Most praised feature (e.g., “Friendly staff”)
- Most requested improvement (e.g., “Easier returns process”)
Until you collect data, this area prompts you to start gathering responses so trends can appear.
4. Insights and Trends Step-by-Step
What it shows
An interactive line chart that tracks positive, negative, and neutral feedback across your selected timeframe. Use the date dropdown (Daily, Weekly, Monthly, Custom Range) to zoom in or out. This visualization helps you spot sentiment spikes around campaigns, product launches, or support changes.
Custom Date Range - Click the calendar icon to pick start/end dates.


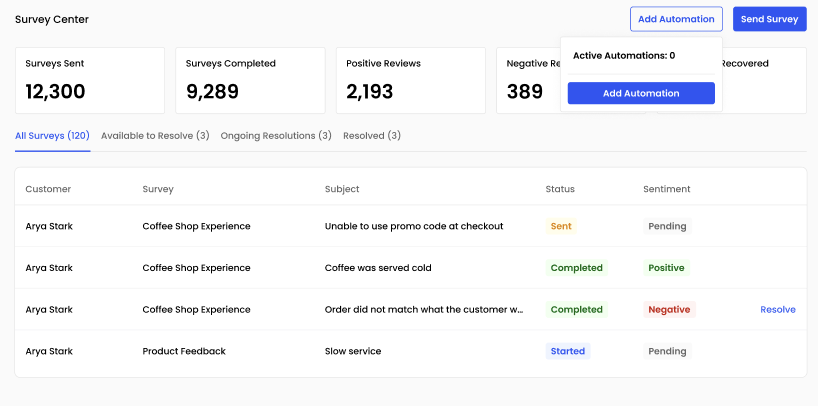
5. Recent Feedback Feed
What it shows
A live feed of your latest customer responses, each entry displaying:
- Customer name
- Survey type
- Feedback subject
- Sentiment tag (Positive, Neutral, Negative)
- Status (Pending, Started, Sent, Completed)
- Quick Resolve button to initiate customer recovery directly
This feed empowers you to react instantly, whether thanking fans or resolving issues.
By familiarizing yourself with these five dashboard areas: onboarding progress, metric cards, insights, sentiment trends, and feedback feed. You’ll master the pulse of your customer feedback in minutes. Next up, learn how to zip between these sections using the sidebar in the Main Navigation Menu: Moving Between Sections.