Understanding KPI Metrics in FeedbackRobot
Introduction
Tracking the right key performance indicators (KPIs) is essential to measure survey success and optimize engagement. In FeedbackRobot, our Dashboard and Survey Center provide a real-time view of your most critical metrics, from completion rates to sentiment trends, so you can make data-driven decisions fast. This article breaks down each KPI card, chart, and table, with clear photo descriptions and alt text to help you locate and understand every metric.
Accessing Your KPI Overview
First, navigate to the Dashboard in the left sidebar. Here, you’ll find top-level KPI cards and a sentiment chart that summarize your survey health at a glance.
Interpreting the Core KPI Cards
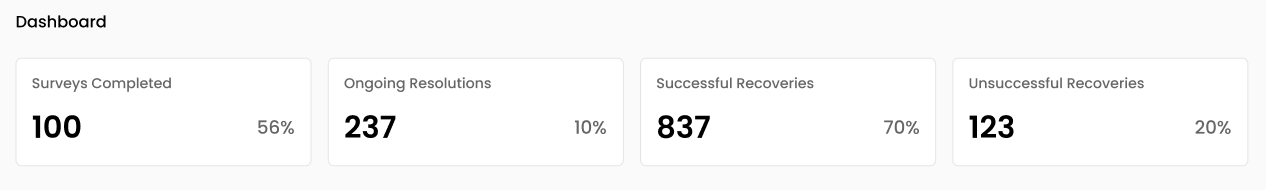
At the top of the Dashboard, four KPI cards display your current performance:
- Surveys Completed - Total surveys that respondents have finished.
- Ongoing Resolutions - Number of feedback items still in your resolution queue.
- Successful Recoveries - Cases where negative feedback was turned into a positive outcome.
- Unsuccessful Recoveries - Cases where you were unable to resolve the issue to the customer’s satisfaction.
Use these metrics to estimate overall engagement (completion) and effectiveness of your follow-up workflows (resolutions).
Reviewing This Week’s Insights
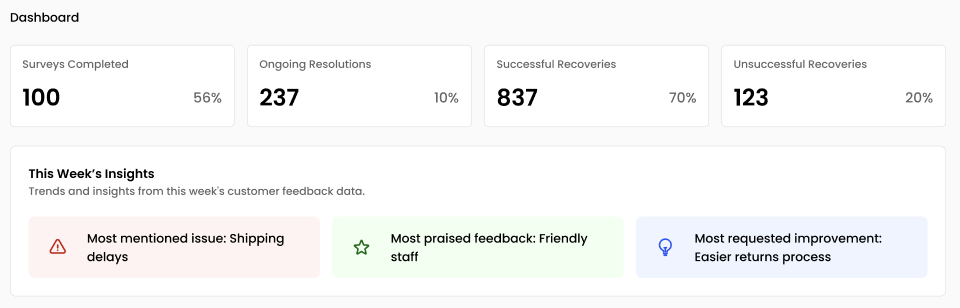
Below the KPI cards, the This Week’s Insights panel highlights:
- Most Mentioned Issue - Top recurring pain point in open-ended feedback.
- Most Praised Feedback - Commonly applauded features or experiences.
- Most Requested Improvement - Feature requests or process tweaks customers ask for most.
Analyzing Customer Sentiment Over Time
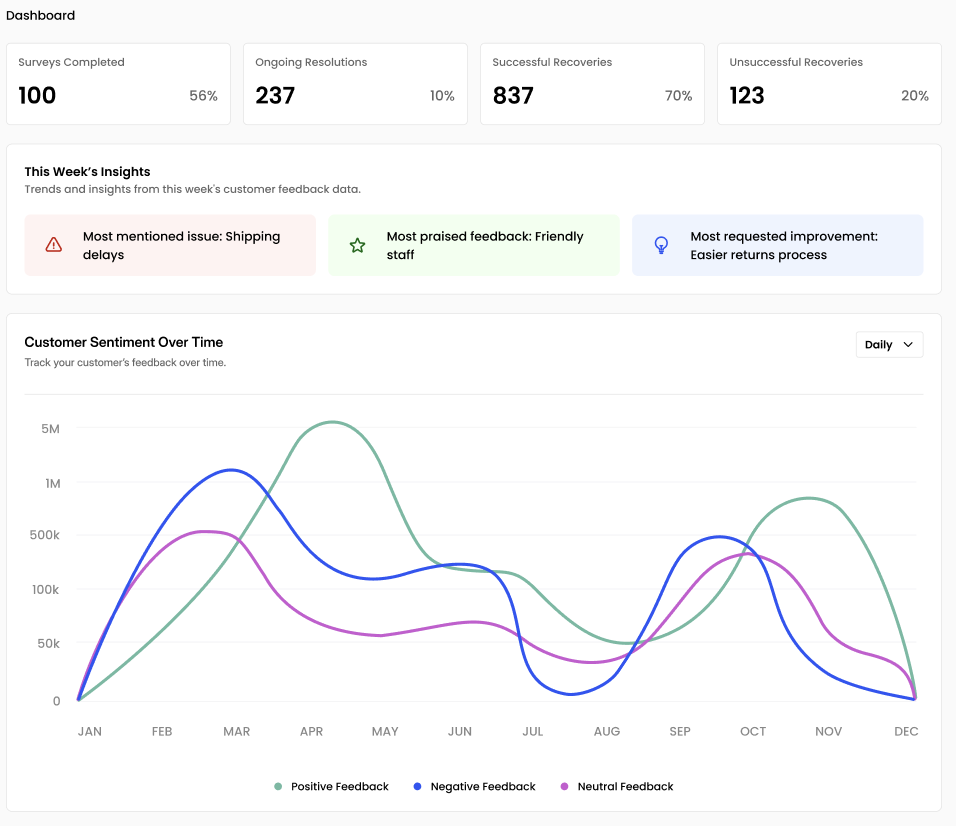
The Customer Sentiment Over Time chart tracks positive, negative, and neutral feedback trends:
- Positive Feedback (green line) shows spikes when product updates or campaigns resonate.
- Negative Feedback (blue line) signals friction points that may need immediate attention.
- Neutral Feedback (purple line) often reflects general comments or suggestions.
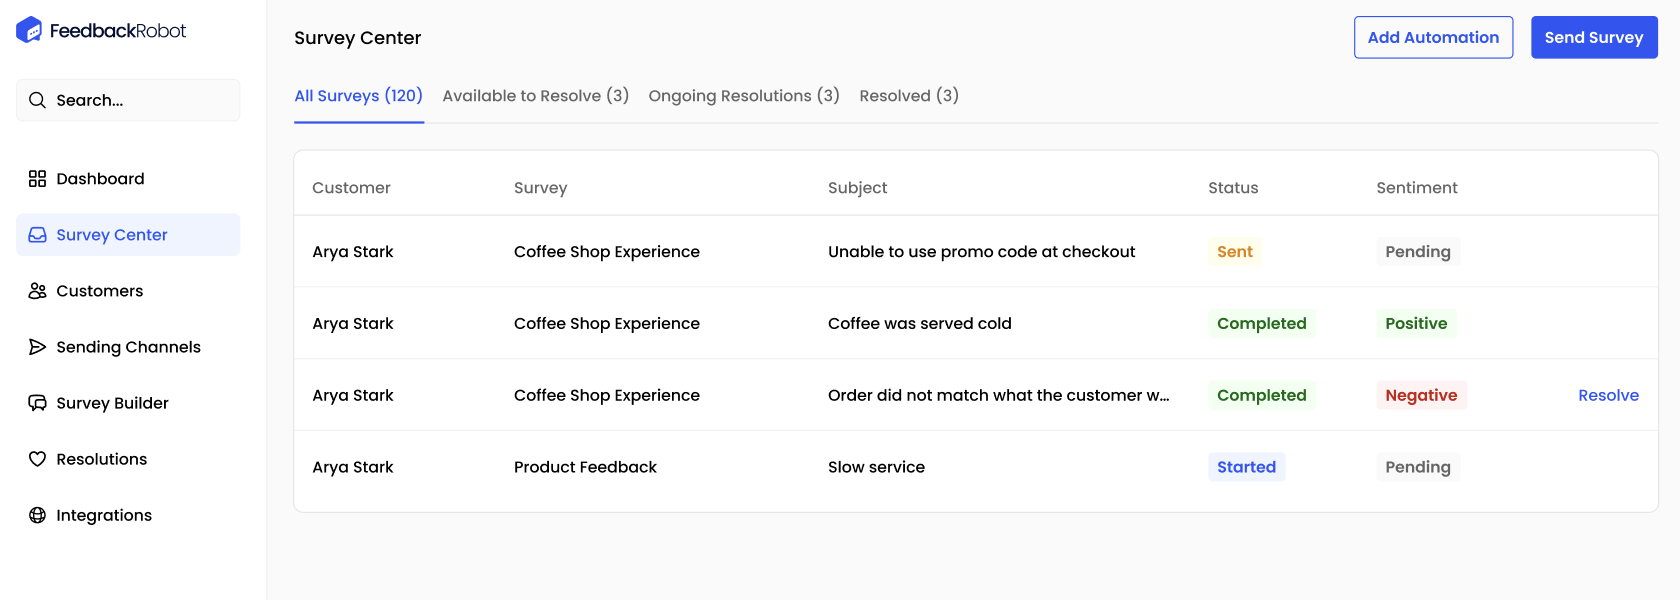
Checking the Recent Feedback Feed
The Recent Feedback Feed at the bottom lists the latest individual responses, each tagged by sentiment and offering a “Resolve” button
- Click Resolve to open the feedback resolution workflow.
- Quickly triage negative comments to prevent churn.
Tips for Optimizing Your KPI Metrics
- Set Benchmarks and Targets - Compare current metrics to past periods to spot improvements or slippages.
- Segment by Channel - Use tags in your distribution settings to see which channel (email, SMS, in-app) delivers the highest completion.
- Act on Insights Weekly - Schedule a weekly review of “This Week’s Insights” to catch emerging trends before they escalate.
- Automate Alerts - Configure keyword alerts for spikes in negative feedback to trigger immediate follow-up.
- A/B Test Templates - Rotate survey templates and compare completion rates in the Survey Center to find your best performer.
Conclusion
With a clear understanding of FeedbackRobot’s KPI metrics, you’re equipped to monitor survey performance, drive higher engagement, and resolve issues swiftly. Regularly check your Dashboard and Survey Center, act on the insights, and watch your customer experience and ROI soar.